

Let us start by acknowledging what many investors sense right now: this is not a normal market environment. The top 10 stocks now account for more than 40% of the S&P 500 Index’s value.
Chart 1
S&P 500 Index Concentration Over Time

Source: Strategas Research, as of September 30, 2025.
Valuations are stretched, as shown in Chart 2 below, and dispersion within artificial intelligence (AI) beneficiaries is particularly high.
Chart 2
Valuation Metrics

Sources: Strategas Research, FactSet, Robert Shiller, and S&P Dow Jones Indices; as of September 30, 2025.
Relatedly, a handful of tech giants dominate market narratives and index earnings, as shown in Chart 3, masking starkly lower growth outside of a handful of companies.
Chart 3
Magnificent 7 Earnings Relative to the Rest of S&P 500 Index Companies

Sources: Strategas Research, FactSet, as of October 27, 2025.
None of these observations are new. Rather, these are simply more extreme examples of the trends we have followed for the past three years. And it’s beginning to feel eerily similar to moments we have experienced before. The late 1990s tech bubble. The “Nifty Fifty” in the 1970s.
Every generation of investors finds a reason to believe the four most dangerous words in investing: “this time is different.”
But what is different this time? What is similar? And how do we adapt?
Let us start with our base case. Innovation is real — AI will undoubtedly reshape economies, improve productivity, and create significant value. The primary beneficiaries of this transformation — cloud services providers and semiconductor related companies — are typically established businesses that generate strong returns on capital and robust free cash flow.
The financing of the AI build-out mirrors this dynamic. Most large-scale investment is funded by the cash flows and balance sheets of the hyperscalers1 themselves, companies with real profitability and capital discipline. Think Microsoft (MSFT), Nvidia (NVDA), Meta Platforms (META), and Alphabet (GOOGL).
We can compare this scenario to our historical examples.
The dot-com boom of the late 1990s is the most obvious (and recent) corollary to the current AI-driven rally. As with the internet then, artificial intelligence today represents a genuine platform shift with the capacity to reshape productivity, business models, and global competitiveness. The key distinction, however, is that unlike many unprofitable dot-com firms, today’s AI leaders are highly profitable and well-capitalized. The result is a market driven today by real earnings power and durable franchises.
However, there are clear capital market similarities. In both periods, investors enthusiastically priced in the transformative potential of a new technology before its full economic impact was visible. Today’s valuations for some of the leading AI beneficiaries have expanded sharply (although nothing close to the extremes observed in the late 1990s),2 and the stock market’s leadership has become unusually concentrated in a handful of mega-cap technology names.
Another parallel is also becoming apparent. Development and usage of large language models (LLMs) by prominent AI startups, such as OpenAI, Perplexity, and Anthropic, represent the ultimate demand driver for these large scale investments and, critically, these customers are not profitable. Therefore, their operations and ongoing model development depend heavily on external financing, often from interrelated partners and investors who are willing to absorb significant near-term losses in hopes of eventual scale leading to profitability.
This dynamic results in a complex interplay between chipmakers, cloud providers, and AI developers, with blurred lines between customers, investors, and competitors, as illustrated by Chart 4.
Chart 4
Complex AI Financial Ecosystem
How Nvidia and OpenAI Fuel the AI Money Machine
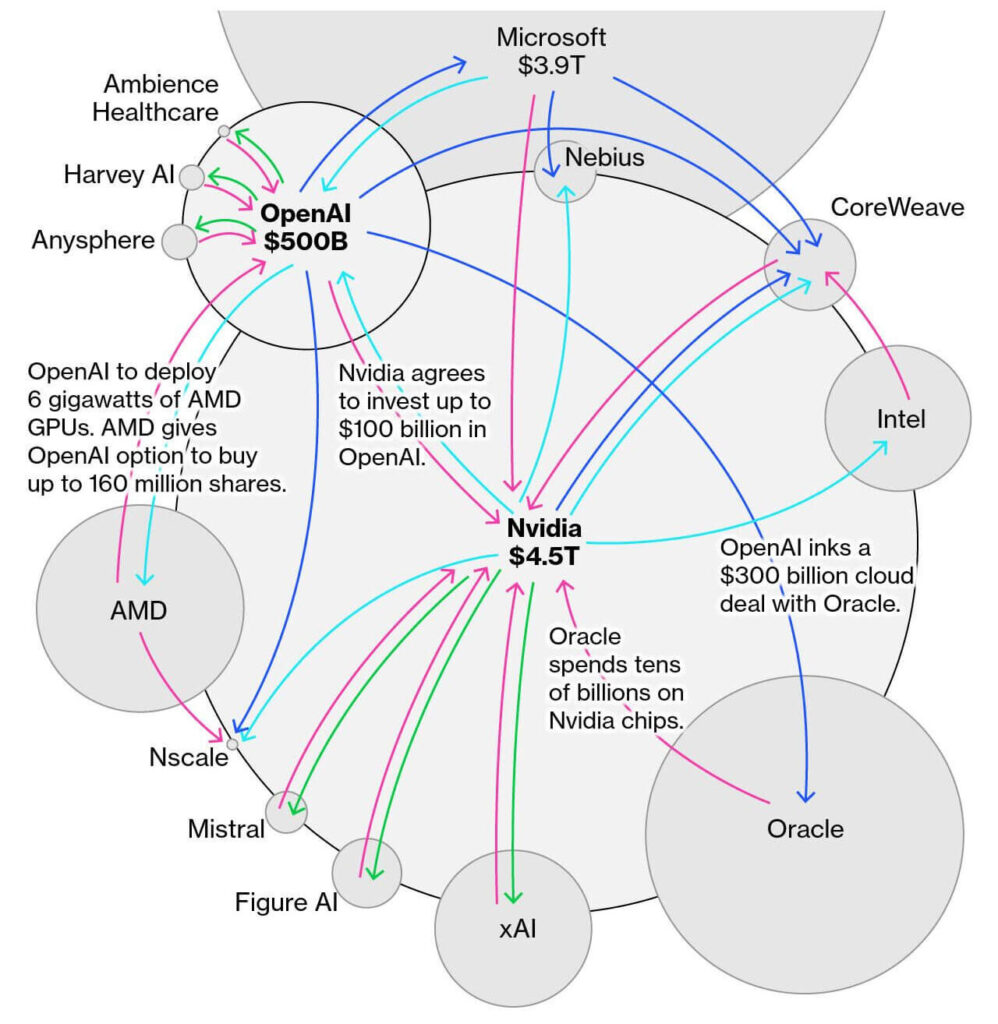

Source: Bloomberg, as of October 2025.
This interconnectedness creates opportunity, but it also echoes past cycles in which enthusiasm ran far ahead of profitability.
The Nifty Fifty was a group of some fifty large-cap U.S. growth stocks that dominated investor enthusiasm in the late 1960s and early 1970s. These companies — that included IBM (IBM), Polaroid, Coca-Cola (KO), Johnson & Johnson (JNJ), McDonald’s (MCD), and Disney (DIS)3 — were viewed as “one-decision” stocks because the businesses were perceived to be so strong, innovative, and predictable that investors believed they could be bought and held indefinitely, regardless of valuation.4
The aftermath was instructive. The S&P 500 Index suffered steep declines in the mid-1970s — inclusive of a ~46% drawdown within 1973-1974, as seen on Chart 5 — due to surging inflation, higher interest rates, and weak economic growth. While some stocks ultimately recovered and delivered strong long-term returns, the episode became a lasting lesson in the dangers of valuation complacency and concentration risk.
Chart 5
S&P 500 Index from 1970 – 1979

Source: Bloomberg, as of October 8, 2025.
There are clear behavioral parallels between the Nifty Fifty era and today’s AI-driven investment boom. In both periods, investors have clustered around a select group of large, high-quality companies seen as long-term secular winners. In the former period, the market favored the aforementioned industrial icons. Today, the equivalents would be technology giants such as Microsoft, NVIDIA, Alphabet, and Amazon. The prevailing narrative in each cycle is that technological transformation justifies unusually high valuations and that the leading firms’ dominance will persist for decades, or even in perpetuity.
However, there are key differences between the two periods. Today’s AI leaders generate substantial cash flow and benefit from highly scalable business models, whereas many Nifty Fifty companies relied on narrower product growth. Moreover, AI’s influence extends across nearly every industry, making its impact broader and more foundational than the consumer and industrial trends that defined the 1970s. At the same time, the structure of modern markets has evolved: while greater institutional efficiency may temper some forms of speculative excess, new dynamics — such as passive concentration, options leverage, and social-media-driven retail flows — introduce risks of their own that have yet to be fully tested.
The lessons from both analogues: underlying innovation is genuine and likely to be economically powerful. But history suggests that exceptional companies can become overvalued, and even transformative technologies often experience cycles of excessive optimism, consolidation, and eventual normalization that can be swift and ruthless.
So, how do we apply these lessons and evolve as portfolio managers?
At Jensen, our strategy has always been rooted in quality — companies with durable competitive advantages, disciplined capital allocation, and predictable long-term earnings growth. That approach has served us well over time, though admittedly, it has been a headwind over the past three years as underexposure to the AI-driven frenzy has hurt relative returns.
Therefore, we have carefully recalibrated within the principles of our investment philosophy. Over the past several years, we have selectively added stocks positioned to benefit from growing AI investment, including the aforementioned Nvidia and Meta Platforms, as well as KLA Corporation (KLAC) and Cadence Design Systems (CDNS). Alongside these additions, we have maintained core positions in Microsoft, Apple (AAPL), and Alphabet, which remain central to both the AI ecosystem and reflect our conviction in enduring business quality.
These holdings illustrate an intentional distinction to our approach: they are all high-quality businesses with demonstrated competitive advantages and high returns on capital, not simply speculative narratives. In other words, we have chosen to own the foundational enablers of AI with proven economic resilience, as measured by return on equity, rather than chase lower-quality, momentum-driven exposures to the theme.
At the same time, we have deliberately balanced that exposure with companies that we categorize as defensive, “all-weather” holdings, such as Marsh McLennan (MMC), Abbott Laboratories (ABT), Procter & Gamble (PG), and McDonald’s. These companies generate consistent cash flow and are expected to provide ballast when momentum-driven markets inevitably cool.
Periods like this test conviction. They invite investors to focus on what is working moment to moment rather than on what endures. Our process is designed for the opposite: to invest in proven quality and let intrinsic business value creation, not market timing, drive investment returns. We have adapted and will continue to do so, where it makes sense, but we remain anchored in our longstanding quality investing discipline. When this cycle normalizes, we are confident that the value proposition of our steadfast approach will be rewarded.
Explore the Jensen Quality Strategies
Quality Growth
U.S. Large-Cap Blend
Quality Mid Cap
U.S. Mid-Cap Blend
Global Quality Growth
Global Large-Cap Growth
1 Hyperscalers: a large cloud service provider that uses hyperscale data centers to offer massive, on-demand computing resources and services like storage, computing, and networking.
2 Stephen, Jen, “AI bubble isn’t near a peak. It’s only at ‘base camp,’” Reuters, Technology, Oct. 21, 2025, https://www.reuters.com/technology/ai-bubble-isnt-near-peak-its-only-base-camp-2025-10-22.
3 Source: Barclay Palmer, Andy Smith and Katharine Beer, “What Is the Nifty 50 and Other Types of Nifty 50?” Investopedia, June 3, 2022, https://www.investopedia.com/ask/answers/08/nifty-fifty-50.asp.
4 Source: James Chen and Thomas J. Catalano, “Nifty Fifty: What it is and how it Works,” Investopedia, August 17, 2024, https://www.investopedia.com/terms/n/niftyfifty.asp.
For a list of the Jensen Quality Growth Strategy’s current holdings, please visit www.jenseninvestment.com/growth-composite-holdings.
The company discussions in this article are solely intended to illustrate the application of our investment approach and are not intended as investment recommendations or an indication that our investment decisions have been or will be profitable.
The information contained herein is current as of the date of this material and is subject to change at any time, based on market and other conditions.
Past performance is no guarantee of future results. The information contained herein represents management’s current expectation of how the Jensen Quality Growth Strategy will continue to be operated in the near term; however, management’s plans and policies in this respect may change in the future. In particular, (i) policies and approaches to portfolio monitoring, risk management, and asset allocation may change in the future without notice and (ii) economic, market and other conditions could cause the Strategy and accounts invested in the Strategy to deviate from stated investment objectives, guidelines, and conclusions stated herein.
Certain information contained in this material represents or is based upon forward-looking statements, which can be identified by the use of terminology such as “may,” “will,” “should,” “expect,” “anticipate,” “target,” “project,” “estimate,” “intend,” “continue,” or “believe,” or the negatives thereof or other variations thereon or comparable terminology. Due to various risks and uncertainties, actual events or results or the actual performance of a client account may differ materially from those reflected or contemplated in such forward-looking statements on market and other conditions.
The S&P 500 Index is a market value weighted index consisting of 500 stocks chosen for market size, liquidity, and industry group representation. The index is unmanaged, and you cannot invest directly in an index.
Jensen Investment Management, Inc., is an investment adviser registered under the Investment Advisers Act of 1940. Registration with the SEC does not imply any level of skill or training. Although taken from reliable sources, Jensen cannot guarantee the accuracy of the information received from third parties. Graphs, charts, and/ or diagrams cannot, by themselves, be used to make investment decisions.
© 2025 Jensen Investment Management
Interested in Learning More?
Related Insights
Jensen News & Insights

The Fed’s interest rate cut has refocused attention on resilience. Jensen’s Adam Calamar explains why quality companies may be best placed to navigate a lower-rate environment.

Stock market concentration has played a pivotal role in the bull market that commenced in early 2023. However, this period of lopsided S&P 500 Index returns is not unprecedented in recent history.

For advisors looking to reduce concentration risk without adding excessive volatility, mid-caps may offer an elegant solution. Read article to discover why.

Market volatility is rising. Factor trends show a shift from growth and momentum to value, cash flow and quality. Read our full analysis.

Read our analysis on how Jensen portfolio companies are positioned to navigate the evolving tariff landscape. For most of our holdings, tariffs represent a manageable business challenge rather than an existential threat. Read our full analysis

The past 18 months presented a complex market landscape. While overall equity returns were strong, this performance was largely driven by a select group of megacap growth stocks.